Projection Distortion Manual
This app shows you how points along a small circle project onto the Mercator, Albers Equal Area, Gnomonic, and Geographic projections. For simplicity, the app uses projections based on a sphere. In contrast, most GIS applications project from ellipsoidal models of the earth.
Using the app
You can select a projection from the drop-down list at the top left. Click, hold, and drag the red dot to move the center of the small circle (represented by the green markers) to a new location. You can change the radius of the small circle (in degrees) by moving the green slider. For all projections, the horizontal red line is the equator and the vertical red line is the prime meridian. If you're using a mouse, then letting the mouse hover over a green marker or the center of the small circle gives the longitude and latitude of the marker in degrees. If you're using a touch screen, touch the center or the small circle markers for the same information.
Small and great circles
If a plane intersects a sphere, it creates a circle of intersection (a trace). If the plane passes through the center of the earth, the trace is a great circle. Otherwise, the trace is a small circle. The planes of small circles that are normal to the earth's axis are traces that we call lines of latitude. The only line of latitude that is a great circle is the equator.
Planes of great circles occur at whatever angle the plane passes through the center of the sphere. In the case of the earth, if the axis of the earth lies on then plane, then its trace forms a great circle that we call a line of longitude (meridian)
A computational look at projections
First, take a look at the topic on Map Projections in the Map Projections module. This app uses both forward and inverse map projections. A forward projection takes a (longitude, latitude, radius) triple and returns an (x, y) pair. An inverse projection takes an (x, y) pair and returns a (longitude, latitude) pair, given a known radius. Equations for the more common projections are readily available online, especially at Wolfram's MathWorld site.
Formulas for forward projections are given as pairs, one for deriving x and another for y:
x = f(λ, φ)
y = g(λ, φ)
And formulas for inverse projections are given in the same way, except that they derive x and y from longitude and latitude:
λ = m(x, y)
φ = n(x, y)
Here is how the Mercator functions are fleshed out for forward and inverse projections (for a sphere) look:
Forward
x = R (λ - λ0)
y = R ln (tan (π/4 + φ/2))
Inverse
φ = (π / 2) – (2 arctan (e-Y/R)
λ = X / R + λ0
See the Map Projections topic for a definition of all the terms
Here is one way that the Mercator projection (for a sphere) can be implemented in Python
Search in the file for Projection.prototype.findMercatorSphereX and Projection.prototype.findMercatorSphereY
My app uses Javascript but the math operations look very similar
Latitude and longitude points on small circles—not intuitive!
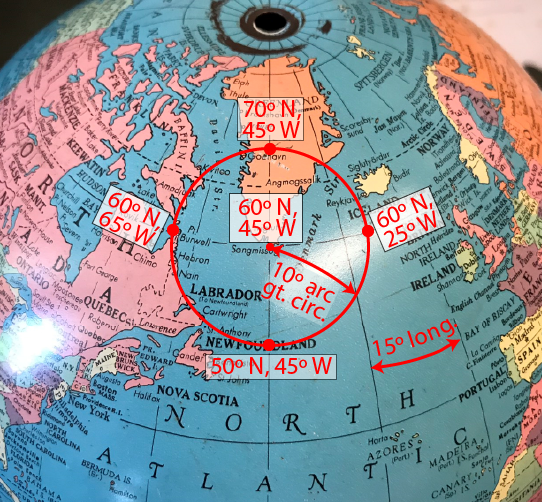
Take a look at this snapshot of my globe
If the globe is spherical, lines of latitude will be spaced at equal distance along meridians
You can see that I've inscribed (throught the miracle of Photoshop) a circle with a 10º arc radius centered on 60º N, 45º W
To be more specific, the arc is a 10º arc of a meridian of the globe
All meridians are lines of longitude and lie on arcs (sections) of great circles
But looking at the coordinates of points on the circle, you can see that it covers 20º latitude (you probably expected that) but 40º of longitude! What's going on here?
As a geographer you know that lines of longitude converge to a point at the poles
Therefore, the northern part of the circle covers a broader range of longitude than the southern part
So given the coordinates of the center of the circle and its radius in degrees or radians, how can you find the coordinates of any point that lie on the circle?
There's a set of formulas for that!
I used the ones found in Snyder and Bugayevskiy (1995) on p. 225.
If you like, you can see the calculations in action here (look at the code in the drawNodeMarkers() function)
The important thing to realize is that a circle of a fixed angular radius will cover different ranges of longitude when drafted on various parts of a globe
Try selecting a point on the circle (just over over them with a mouse or touch them on touch screen) to see their latitude and longitude values